For decades, maritime operators have lacked precise measurements quantifying hull fouling's operational impact. Groundbreaking University of Melbourne research, employing advanced underwater scanning technology, now provides definitive data: even minimal hull fouling imposes significant, measurable fuel penalties directly affecting profitability [1].
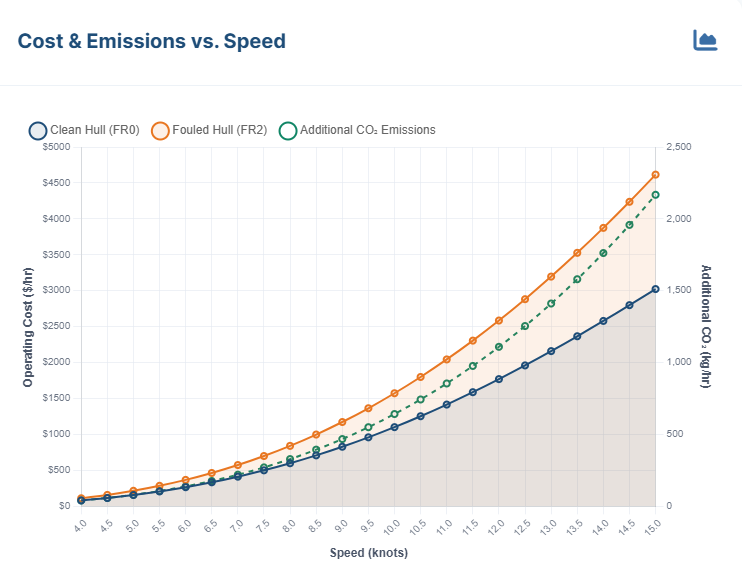
A vessel with heavy calcareous fouling (FR5) experiences 193% increased frictional resistance. For the 93-meter cruise ship studied, this translated to $1,273 hourly fuel costs and 1.8 tonnes additional CO₂ emissions when maintaining cruise speed [1]. Even light slime (FR1) increases fuel consumption by 10%, while moderate slime (FR2) imposes 20–30% penalties [1].
- Light biofilm (FR1): Increases fuel consumption by up to 10% [1]
- Moderate slime (FR2): Results in 20–30% higher fuel consumption [1]
- Heavy calcareous growth (FR4–FR5): Can drive fuel costs up by 45–60% [1]
- Speed factor: Drag penalties increase dramatically at higher velocities due to the cubic relationship between speed and resistance [1]
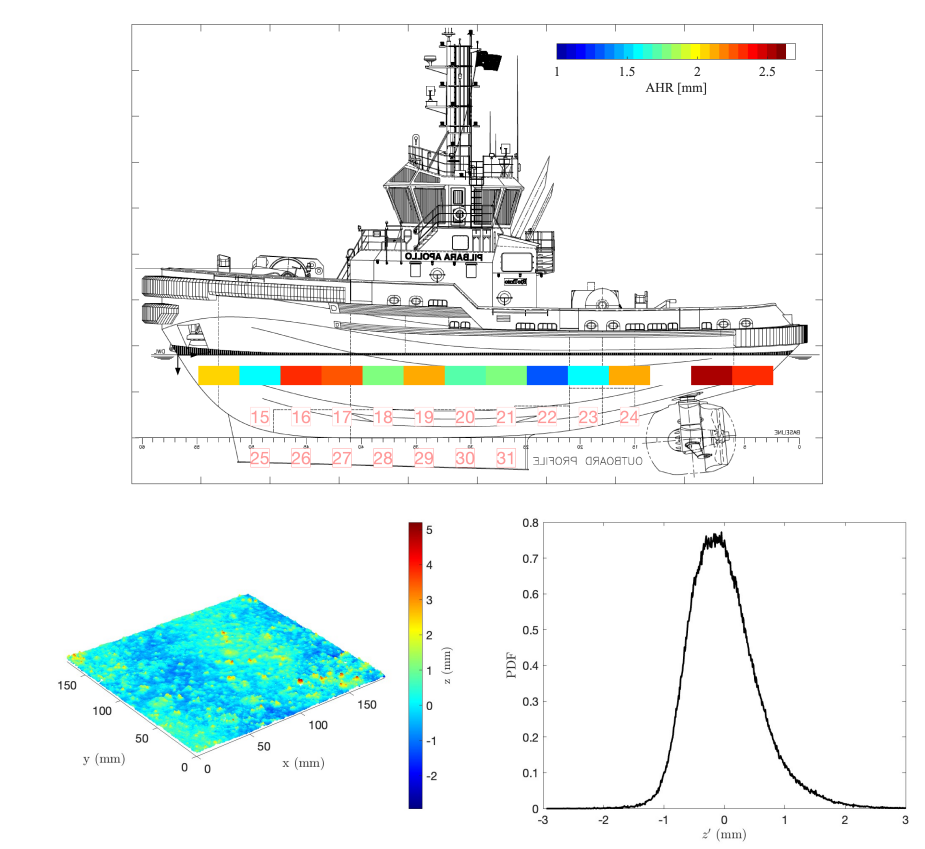
The December 2024 tugboat study revealed moderate fouling caused 110% increased skin friction coefficient and 58% total resistance increase at 8 knots—equivalent to $292 hourly fuel costs and 0.4 tonnes hourly CO₂ emissions [2]. With shipping accounting for 3% of global CO₂ emissions, these findings extend beyond fuel costs to regulatory compliance under IMO's tightening carbon intensity indicator (CII) requirements [3].
Technical Methodology
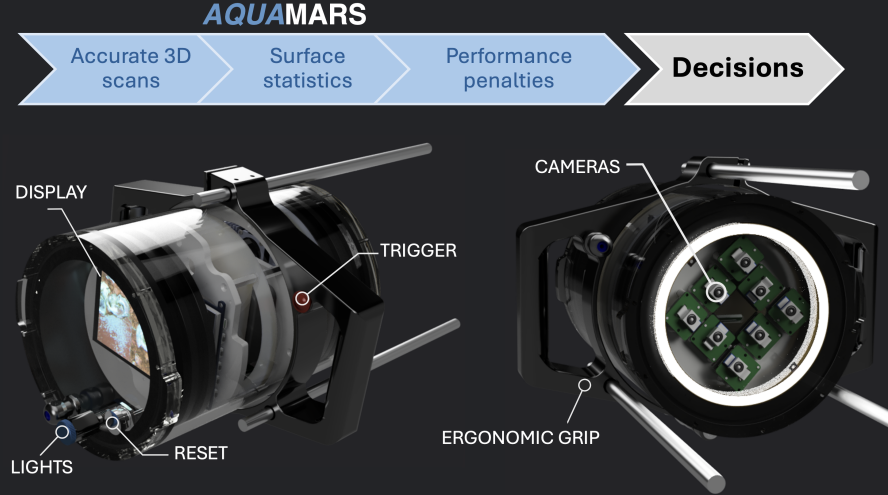
AQUAMARS (Advanced Quality Underwater Mapping and Analysis for Rough Surfaces) represents a paradigm shift in hull assessment. This diver-operated system uses eight high-resolution cameras creating 3D surface reconstructions with sub-millimeter accuracy, measuring equivalent sandgrain roughness (ks) that directly correlates to drag penalties [2]. The technology translates complex fluid dynamics into practical operational metrics, revealing fouling affects frictional resistance (cubic speed relationship) and wave-making resistance (higher-order speed relationship).
Validated Performance Strategies
Research validates four critical hull management approaches [1, 2, 4]:
Proactive Monitoring: Regular ROV/diver inspections identify early-stage fouling when intervention remains cost-effective, preventing exponential growth of marine organisms and operational costs.
Strategic Cleaning: Gentle hull cleaning manages biofouling without compromising coating integrity. The cruise ship study demonstrated timely intervention could save $3 million annually in fuel costs [1].
Comprehensive Integration: Combining propeller maintenance with hull cleaning yields compounded efficiency gains across naval and commercial applications [4].
Performance Tracking: Continuous speed-power monitoring provides early efficiency loss warnings, enabling data-driven maintenance decisions.
Economic and Environmental Impact
Commercial vessels operating 200 days annually face $2-3 million additional fuel costs with moderate-to-heavy fouling. Across global fleets, economic impact reaches tens of billions annually—costs transferred to consumers through higher shipping rates. Each percentage point of increased resistance translates directly to higher emissions, making hull fouling management critical for decarbonization strategies. Maintaining clean hulls could reduce global shipping industry carbon footprint by millions of tonnes annually.
The University of Melbourne research provides both quantitative framework and operational roadmap. Ongoing studies examine different vessel types, operating conditions, and fouling patterns, with future developments including real-time monitoring systems and predictive optimization models.
An online Fouling Cost Calculator (www.marinestream.com.au Tools section) translates research findings into practical cost projections, allowing operators to input vessel parameters and fouling conditions for immediate fuel penalty and emissions estimates. This bridges academic research with operational decision-making, becoming more accurate as additional vessels are scanned.
Translating Research into Naval Operations
Australia's Royal Australian Navy has embraced evidence-based hull maintenance protocols through collaborative work involving Franmarine, demonstrating advanced underwater scanning integration into operational naval maintenance programs. These initiatives validate biofouling management as technology-enabled capability simultaneously enhancing operational readiness while maintaining Australia's maritime biosecurity standards. Naval implementation provides critical proof-of-concept for broader maritime industry adoption, demonstrating successful translation of scientific research into operational doctrine balancing performance optimization with environmental stewardship.
Strategic Imperative: From Data to Action
Rising fuel costs, tightening environmental regulations, and quantifiable performance metrics create unprecedented opportunities for maritime operators to transform hull maintenance approaches. The research presents clear strategic imperative: transition from reactive maintenance schedules to proactive, data-driven hull management systems.
This requires immediate investment in underwater assessment technologies, performance monitoring protocols, and cleaning intervention thresholds based on quantified resistance penalties rather than arbitrary timelines. For fleet managers, the choice is stark—embrace precision hull maintenance as core operational competency, or accept mounting inefficiency costs in increasingly competitive, regulated maritime environments.
The technology exists, the economic case is proven, and environmental necessity is undeniable. The question is implementation speed: how quickly can operators deploy these research-validated strategies to secure operational efficiency and regulatory compliance in the years ahead.
- [1] L. Tsigaras, A. Kogios, J. Monty (2025). "Quantitative assessment of increased frictional drag due to hull fouling using underwater surface scanning - Coral Adventurer Study." University of Melbourne & Franmarine Underwater Services.
- [2] Kevin, L. Tsigaras, A. Kogios, J. Monty (2024). "Quantitative assessment of increased frictional drag due to hull fouling using underwater surface scanning - Rio Tinto Tugboat Study." University of Melbourne.
- [3] International Maritime Organization (2023). "Guidelines for the control and management of ships' biofouling to minimize the transfer of invasive aquatic species (MEPC.378(80))."
- [4] Schultz, M.P., Bendick, J.A., Holm, E.R. & Hertel, W.M. (2011). "Economic impact of biofouling on a naval surface ship." Biofouling, 27(1), 87-98.